|
R&D Systems
anti goat gal3 antibody Anti Goat Gal3 Antibody, supplied by R&D Systems, used in various techniques. Bioz Stars score: 94/100, based on 1 PubMed citations. ZERO BIAS - scores, article reviews, protocol conditions and more https://www.bioz.com/result/anti goat gal3 antibody/product/R&D Systems Average 94 stars, based on 1 article reviews
anti goat gal3 antibody - by Bioz Stars,
2026-04
94/100 stars
|
Buy from Supplier |
|
Bio-Techne corporation
goat anti gal3  Goat Anti Gal3, supplied by Bio-Techne corporation, used in various techniques. Bioz Stars score: 99/100, based on 1 PubMed citations. ZERO BIAS - scores, article reviews, protocol conditions and more https://www.bioz.com/result/goat anti gal3/product/Bio-Techne corporation Average 99 stars, based on 1 article reviews
goat anti gal3 - by Bioz Stars,
2026-04
99/100 stars
|
Buy from Supplier |
|
R&D Systems
goat anti gal 3 Goat Anti Gal 3, supplied by R&D Systems, used in various techniques. Bioz Stars score: 90/100, based on 1 PubMed citations. ZERO BIAS - scores, article reviews, protocol conditions and more https://www.bioz.com/result/goat anti gal 3/product/R&D Systems Average 90 stars, based on 1 article reviews
goat anti gal 3 - by Bioz Stars,
2026-04
90/100 stars
|
Buy from Supplier |
|
R&D Systems
biotinylated goat anti galectin 3 gal 3 antibodies  Biotinylated Goat Anti Galectin 3 Gal 3 Antibodies, supplied by R&D Systems, used in various techniques. Bioz Stars score: 90/100, based on 1 PubMed citations. ZERO BIAS - scores, article reviews, protocol conditions and more https://www.bioz.com/result/biotinylated goat anti galectin 3 gal 3 antibodies/product/R&D Systems Average 90 stars, based on 1 article reviews
biotinylated goat anti galectin 3 gal 3 antibodies - by Bioz Stars,
2026-04
90/100 stars
|
Buy from Supplier |
|
Vector Laboratories
biotinylated lectins Biotinylated Lectins, supplied by Vector Laboratories, used in various techniques. Bioz Stars score: 93/100, based on 1 PubMed citations. ZERO BIAS - scores, article reviews, protocol conditions and more https://www.bioz.com/result/biotinylated lectins/product/Vector Laboratories Average 93 stars, based on 1 article reviews
biotinylated lectins - by Bioz Stars,
2026-04
93/100 stars
|
Buy from Supplier |
|
R&D Systems
goat polyclonal anti galectin gal 3 antibody Goat Polyclonal Anti Galectin Gal 3 Antibody, supplied by R&D Systems, used in various techniques. Bioz Stars score: 90/100, based on 1 PubMed citations. ZERO BIAS - scores, article reviews, protocol conditions and more https://www.bioz.com/result/goat polyclonal anti galectin gal 3 antibody/product/R&D Systems Average 90 stars, based on 1 article reviews
goat polyclonal anti galectin gal 3 antibody - by Bioz Stars,
2026-04
90/100 stars
|
Buy from Supplier |
|
Santa Cruz Biotechnology
goat anti-human gal-3 antibody sc-19280 Goat Anti Human Gal 3 Antibody Sc 19280, supplied by Santa Cruz Biotechnology, used in various techniques. Bioz Stars score: 90/100, based on 1 PubMed citations. ZERO BIAS - scores, article reviews, protocol conditions and more https://www.bioz.com/result/goat anti-human gal-3 antibody sc-19280/product/Santa Cruz Biotechnology Average 90 stars, based on 1 article reviews
goat anti-human gal-3 antibody sc-19280 - by Bioz Stars,
2026-04
90/100 stars
|
Buy from Supplier |
|
R&D Systems
biotinylated goat anti mouse gal 3 antibody Biotinylated Goat Anti Mouse Gal 3 Antibody, supplied by R&D Systems, used in various techniques. Bioz Stars score: 90/100, based on 1 PubMed citations. ZERO BIAS - scores, article reviews, protocol conditions and more https://www.bioz.com/result/biotinylated goat anti mouse gal 3 antibody/product/R&D Systems Average 90 stars, based on 1 article reviews
biotinylated goat anti mouse gal 3 antibody - by Bioz Stars,
2026-04
90/100 stars
|
Buy from Supplier |
|
R&D Systems
goat-derived anti-gal3  Goat Derived Anti Gal3, supplied by R&D Systems, used in various techniques. Bioz Stars score: 90/100, based on 1 PubMed citations. ZERO BIAS - scores, article reviews, protocol conditions and more https://www.bioz.com/result/goat-derived anti-gal3/product/R&D Systems Average 90 stars, based on 1 article reviews
goat-derived anti-gal3 - by Bioz Stars,
2026-04
90/100 stars
|
Buy from Supplier |
|
R&D Systems
goat anti gal3  Goat Anti Gal3, supplied by R&D Systems, used in various techniques. Bioz Stars score: 93/100, based on 1 PubMed citations. ZERO BIAS - scores, article reviews, protocol conditions and more https://www.bioz.com/result/goat anti gal3/product/R&D Systems Average 93 stars, based on 1 article reviews
goat anti gal3 - by Bioz Stars,
2026-04
93/100 stars
|
Buy from Supplier |
Image Search Results
Journal: Acta Neuropathologica
Article Title: Galectin-3 shapes toxic alpha-synuclein strains in Parkinson’s disease
doi: 10.1007/s00401-023-02585-x
Figure Lengend Snippet: Antibodies used for immunostainings
Article Snippet:
Techniques:

Journal: Acta Neuropathologica
Article Title: Galectin-3 shapes toxic alpha-synuclein strains in Parkinson’s disease
doi: 10.1007/s00401-023-02585-x
Figure Lengend Snippet: Antibodies used for western blot
Article Snippet:
Techniques: Western Blot

Journal: Acta Neuropathologica
Article Title: Galectin-3 shapes toxic alpha-synuclein strains in Parkinson’s disease
doi: 10.1007/s00401-023-02585-x
Figure Lengend Snippet: Galectin-3 (GAL3) is associated with Lewy Bodies (LB) and Pale Bodies (PB) in PD patients. a Immunofluorescence analysis of GAL3 in association with distinct forms of human α-synuclein (hSYN) aggregation. Β-sheet structure marker Methoxy-X04 was used to discriminate between LB and PB. Multiple core LB and PB are shown. GAL3 is present in both types of aggregates independently of neuromelanin presence. Scale bar 10 µm. b GAL3 is present in a diverse subset of hSYN accumulations with a precise negative correlation (blue arrows). Scale bar 10 µm. c Proportion of hSYN aggregates that are associated with GAL3. Methoxy-X04 was used as a specific marker of LB. Single (sLB) and multiple core LB (mLB) were discriminated ( p < 0.05). d Protein levels of GAL3 measured by ELISA in the Cortex of Control and PD Patients (PD-Cx) ( p < 0.001), and in the Substantia nigra (PD-SN) of PD patients
Article Snippet:
Techniques: Immunofluorescence, Marker, Enzyme-linked Immunosorbent Assay

Journal: Acta Neuropathologica
Article Title: Galectin-3 shapes toxic alpha-synuclein strains in Parkinson’s disease
doi: 10.1007/s00401-023-02585-x
Figure Lengend Snippet: GAL3 variably associates with lysosomes in the outer layers LB in all the studied patients. a GAL3 surrounding LB was found in all 6 patients studied (P.1–6). Variable amount of GAL3 vesicles was found. Note lower hSYN staining in the presence of GAL3. Scale bar 10 µm. b High resolution microscopy showed a ring-like pattern for GAL3 without any hSYN inside. Scale bar 10 µm. c Immunofluorescence analysis revealed that GAL3 is associated with recruited lysosomes (LAMP1) in the vicinities of LB. Scale bar 10 µm. d Combination of GAL3 immunohistochemistry with immunofluorescence showed that GAL3 is associated with autofluorescent lipofuscin vesicles in PD patients. Scale bar 10 µm. e Immunofluorescence analysis revealed that GAL3 accumulates inside MAP2 + neurons in the viccinities of LB. Scale bar 10 µm
Article Snippet:
Techniques: Staining, Microscopy, Immunofluorescence, Immunohistochemistry

Journal: Acta Neuropathologica
Article Title: Galectin-3 shapes toxic alpha-synuclein strains in Parkinson’s disease
doi: 10.1007/s00401-023-02585-x
Figure Lengend Snippet: Recombinant galectin-3 (Gal3) impairs synuclein aggregation in vitro. a Thioflavin-T (ThT) aggregation assay showed a rapid aggregation for recombinant human α-synuclein (αSyn) that was impaired in the presence of recombinant Gal3 (purple line). Notably, carbohydrate recognition domain (CRD) mutation (Gal3 R186S ) reverted this effect. b Proteinase K (PK) digestion at increasing concentration of resultant conditions from a) showed a lower stability in the presence of Gal3 (red line). c When Gal3 was added to αSyn pre-formed fibrils (PFF) after aggregation was completed, an increased signal was observed in the presence of ThT after 15 h. d PK digestion at increasing concentration of resultant fibrils from ( c ) showed similar stability of PFF in the presence of Gal3. e Electron microscopy images after uranyl negative staining of PFF after 24 h incubation with Gal3 (right panels). Note a marked disorganization of the fibrils network after Gal3 incubation with increased shortened species (upper right panel), and the change of morphology (lower right panel) with rounded structures attached to the fibrils. Scale bar 1 µm (upper panels) and 200 nm (lower panels). f Native PAGE Western Blot of the final results obtained in c ) Note that Gal3 promoted an increase in smaller soluble species released by αSyn fibrils. g Direct interaction of Gal3 with different αSyn species was investigated by ELISA. 2 µM Gal3 concentration were precoated in a 96 well plate and 2 µM αSyn species were incubated. 450 nm absorbance was measured to detect bounded protein. All types of species presented high affinity for Gal3 coated well compared with the control condition in absence of αSyn ( p < 0.001). No relevant absorbance was detected in the absence of precoated Gal3 (data not shown). h Addition of sonicated PFF pre-incubated with gal3 (PFFgal3) for 30 min to dopaminergic cell line N27 for 48 h led to a decreased number of cells compared with PFF alone (** p < 0.01; *** p < 0.001). i Graphical abstract representing the hypothesis proposed based on our in vitro studies about Gal3-αSyn interaction. Gal3 could impact αSyn elongation in de novo formation of fibrils while also affecting structured fibrils with little impact on the dense core but release of small species
Article Snippet:
Techniques: Recombinant, In Vitro, Mutagenesis, Concentration Assay, Electron Microscopy, Negative Staining, Incubation, Clear Native PAGE, Western Blot, Enzyme-linked Immunosorbent Assay, Sonication

Journal: Acta Neuropathologica
Article Title: Galectin-3 shapes toxic alpha-synuclein strains in Parkinson’s disease
doi: 10.1007/s00401-023-02585-x
Figure Lengend Snippet: GAL3 early overexpression leads to chronic activation and neuronal internalization. a Western Blot against GAL3 from brain homogenates from WT and Gal3KO mice revealed constitutive expression of GAL3 in WT mice. b Western Blot quantification of total GAL3 protein in WT mesencephalon samples. No difference was found between contralateral (Right hemisphere, RH) and ipsilateral (Left hemisphere, LH) hemispheres. Data are expressed as percentage fold to actin. c Double immunofluorescence 6 months after adenovirus injection showed clusters of CD11B + microglial cells highly reactive for GAL3. Internalized pSYN led to overexpression of GAL3 in WT microglia. pSYN was internalized by microglia independently of GAL3 genotype. Scale bar 20 µm. d TNFα quantification in SN and STR was performed on a MesoScale Discovery platform analysing brain extracts from AAV5-hSYN injected SN and STR ( p < 0.05). e Neuronal primary cell culture from WT mice showed efficient Gal3 internalization after incubation with 0.8 µM gal3 for 10 days. Note no difference in endogenous αSyn staining after addition of Gal3. f hSYN/GAL3 double immunofluorescence from injection area of mice WT brains 2 weeks after injection revealed no colocalization and significant upregulation of GAL3. Scale bar 50 µm. GAL3 lo /hSYN colocalization (white arrow) can be found near highly reactive GAL3 + cell indicating GAL3 release and neuronal GAL3 internalization. Scale bar 10 µm. g hSYN/GAL3 double immunofluorescence of mice WT brains 4 weeks after adenovirus injection revealed neuronal GAL3 staining. Scale bar 10 µm
Article Snippet:
Techniques: Over Expression, Activation Assay, Western Blot, Expressing, Immunofluorescence, Injection, Cell Culture, Incubation, Staining
Journal: Upsala Journal of Medical Sciences
Article Title: Surface glycans contribute to differences between seminal prostasomes from normozoospermic and oligozoospermic men
doi: 10.1080/03009734.2019.1592266
Figure Lengend Snippet: Surface glycosylation of seminal prostasomes: lectin- and immune-transmission electron microscopy. A: Lectin-TEM using SNA. Inserts show enlarged characteristic pattern of SNA-reactivity to each sample group. B: Lectin-TEM using ConA. Inserts show enlarged characteristic pattern of ConA-reactivity to vesicles in each sample group. In O, staining of some proteinaceous material was also observed (arrowheads). C: Immune-TEM using anti-galectin-3 antibodies. Inserts show enlarged characteristic pattern of anti-gal-3-reactivity to each sample group. Micrographs show most characteristic patterns obtained. Although differences in the reactivity of particular vesicles could be noticed, it does not affect the general reactivity of the sample (as in IEC when taking all vesicles into account). (N = seminal prostasomes from normozoospermic men; O = seminal prostasomes from oligozoospermic men).
Article Snippet: Monoclonal anti-CD63 antibody (clone TS63) was from Abcam (Cambridge, UK) and
Techniques: Transmission Assay, Electron Microscopy, Staining
Journal: International Journal of Molecular Sciences
Article Title: Gal3 Plays a Deleterious Role in a Mouse Model of Endotoxemia
doi: 10.3390/ijms23031170
Figure Lengend Snippet: Gal3 knockout mice are more resistant to septic shock. WT and Gal3KO mice were subjected to an intraperitoneal injection of LPS (5 mg/kg of body weight) or saline solution ( N = 12 animals per group). The mortality rate was monitored regularly for 80 h and represented as percentage of survival. The statistical analysis was performed using the Log-Rank Test. Abbreviations: WT, wild type mice; KO, Gal3 knockout mice; WTLPS, wild type mice treated with LPS; KOLPS, Gal3 knockout mice treated with LPS. *, p < 0.05.
Article Snippet: Primary antibodies used were goat-derived
Techniques: Knock-Out, Injection, Saline

Journal: International Journal of Molecular Sciences
Article Title: Gal3 Plays a Deleterious Role in a Mouse Model of Endotoxemia
doi: 10.3390/ijms23031170
Figure Lengend Snippet: Determination of Gal3 on immune cells of peripheral blood. Levels of Gal3 were determined by flow cytometry in peripheral blood of mice ( N = 5 animals). Briefly, after blood collection, erythrocytes were lysed using an ammonium chloride lysis solution. Cells were washed and stained with surface marker antibodies for 20 min on ice. Gal-3 expression was analyzed in B-cells, CD4 + T-cells, CD8 + T-cells, double negative T-cells, dendritic cells, neutrophils, and macrophages. Results are expressed as median ± IQR. Statistical significance was calculated using the Mann–Whitney U test. Abbreviations: DCs, dendritic cells; Macro, macrophages; Monoc, monocytes; Neutro, neutrophils. *, p < 0.01.
Article Snippet: Primary antibodies used were goat-derived
Techniques: Flow Cytometry, Lysis, Staining, Marker, Expressing, MANN-WHITNEY

Journal: International Journal of Molecular Sciences
Article Title: Gal3 Plays a Deleterious Role in a Mouse Model of Endotoxemia
doi: 10.3390/ijms23031170
Figure Lengend Snippet: Determination of Gal3 and TLR4. ( A )The expression of Gal3 in serum was measured by ELISA. Blood samples were collected from the heart of mice 1 h after LPS/saline injection. Results are mean ± SD of N = 4–6 animals, expressed as ng/mLof the analyzed protein and relative to the WT group. Statistical significance (two tailed Student’s t test): p < 0.001. Using RT-PCR, the mRNA expression of Gal3 was measured in the liver ( B ), spleen ( C ), and peritoneal macrophages ( D ). Using RT-PCR, the mRNA expression of TLR4 was measured in the liver ( E ), spleen ( F ), and peritoneal macrophages ( G ). For PCR analysis, animals were culled 1 h after LPS/saline injection. Results are mean ± SD of N = 3–10 animals, normalized to β-actin and expressed as relative expression to the WT group. Statistical significance (one-way ANOVA followed by the LSD post hoc test for multiple comparisons): *—compared with WT group; #—compared with KO group; $—compared with WTLPS group; p < 0.001 for ( B – D ), p < 0.05 for ( G ). Abbreviations: WT, wild type mice; KO, Gal3 knockout mice; WTLPS, wild type mice treated with LPS; KOLPS, Gal3 knockout mice treated with LPS.
Article Snippet: Primary antibodies used were goat-derived
Techniques: Expressing, Enzyme-linked Immunosorbent Assay, Saline, Injection, Two Tailed Test, Reverse Transcription Polymerase Chain Reaction, Knock-Out

Journal: International Journal of Molecular Sciences
Article Title: Gal3 Plays a Deleterious Role in a Mouse Model of Endotoxemia
doi: 10.3390/ijms23031170
Figure Lengend Snippet: Gal3 expression in the liver, lung, and spleen of mice from the different treatments assayed. ( A ) Section from liver showing some Gal3 positive cells in a WT animal. ( B ) Immunoreactivity of Gal3 in a liver section from a WT animal injected i.p. with LPS. ( F ) Section from spleen showing some Gal3 positive cells in a WT animal. ( G ) Immunoreactivity of Gal3 in a spleen section from a WT animal injected i.p. with LPS. Again, a strong reaction can be seen. ( I ) Section from lung showing some Gal3 positive cells in a WT animal. ( G ) Immunoreactivity of Gal3 in a lung section from a WT animal injected i.p. with LPS, showing a strong reaction. As expected, in the case of Gal3KO animals, immunoreactivity of Gal3 was not found in any treatment assayed ( C , D ). Scale bar: ( A – D ), 100 μm; ( F – J ), 20 μm. Quantification of the density of Gal3 positive cells in liver ( E ), spleen ( H ), and lung ( K ) from the different treatments assayed. Results are mean ± SD of N = 3–4 animals, expressed as number of cells per mm 2 . Statistical significance (two tailed Student- t test): * p < 0.01; ** p < 0.05. Abbreviations: WT, wild type mice; WTLPS, wild type mice treated with LPS; KO, Gal3 knockout mice; KOLPS, Gal3 knockout mice treated with LPS.
Article Snippet: Primary antibodies used were goat-derived
Techniques: Expressing, Injection, Two Tailed Test, Knock-Out

Journal: International Journal of Molecular Sciences
Article Title: Gal3 Plays a Deleterious Role in a Mouse Model of Endotoxemia
doi: 10.3390/ijms23031170
Figure Lengend Snippet: Double immunofluorescence of Iba1 andGal3 expression. ( A ) Iba1 staining in the liver of a WT animal. Virtually, no monocytes/macrophages are infiltrated in control animals. ( B ) Section from liver showing some Gal3 positive cells in a WT animal. ( C ) Merge image showing co-localization of Iba1 + cells and Gal3 + cells. ( D ) Immunoreactivity of Iba1 in a liver section from a WT animal injected i.p. with LPS. A strong reaction can be seen. ( E ) Immunoreactivity of Gal3 in WT animals injected with LPS. ( F ) Merge image showing co-localization of Iba1 + cells and Gal3 + cells (arrows). Most Gal3 + cells co-localize with Iba1 + cells. Scale bar: 50 μm.
Article Snippet: Primary antibodies used were goat-derived
Techniques: Immunofluorescence, Expressing, Staining, Injection

Journal: International Journal of Molecular Sciences
Article Title: Gal3 Plays a Deleterious Role in a Mouse Model of Endotoxemia
doi: 10.3390/ijms23031170
Figure Lengend Snippet: Effect of Gal3 deletion on the expression of TNF-α , iNOS , IL-1β , IL-6 , YM1 , IL-10 , and arginase mRNAs in the liver, spleen, and macrophages of mice from the different treatments assayed, measured by RT-PCR ( A – U ). Animals were culled 1 h after LPS/saline injection. Results are mean ± SD of N = 3–10 animals, normalized to β-actin and expressed as relative expression to the WT group. Statistical significance (one-way ANOVA followed by the LSD post hoc test for multiple comparisons): *—compared with WT group; #—compared with KO group; $—compared with WTLPS group; p < 0.001 for ( A – F , H , J – M , O , P , T ); p < 0.01 for ( G , N , S ); p < 0.05 for ( Q , R , U ). Abbreviations: WT, wild type mice; KO, Gal3 knockout mice; WTLPS, wild type mice treated with LPS; KOLPS, Gal3 knockout mice treated with LPS.
Article Snippet: Primary antibodies used were goat-derived
Techniques: Expressing, Reverse Transcription Polymerase Chain Reaction, Saline, Injection, Knock-Out

Journal: International Journal of Molecular Sciences
Article Title: Gal3 Plays a Deleterious Role in a Mouse Model of Endotoxemia
doi: 10.3390/ijms23031170
Figure Lengend Snippet: CD68 expression in liver. Representative immunostaining from sections of the different treatments assayed. WT ( A ) and KO ( C ) animals show a normal pattern of CD68 expression; however, the treatment with LPS produces a strong induction of CD68-positive cells in WT animals ( B ). Absence of Gal3 clearly reduces this effect ( D ). Scale bar: 100 μm. ( E ) Quantification of the density of CD68 positive cells in liver. Results are mean ± SD of N = 3 animals, expressed as number of cells per mm 2 . Statistical significance (one-way ANOVA followed by the LSD post hoc test for multiple comparisons): *—compared with WT group; #—compared with KO group; $—compared with WTLPS group; p < 0.01. Abbreviations: WT, wild type mice; WTLPS, wild type mice treated with LPS; KO, Gal3 knockout mice; KOLPS, Gal3 knockout mice treated with LPS.
Article Snippet: Primary antibodies used were goat-derived
Techniques: Expressing, Immunostaining, Knock-Out

Journal: International Journal of Molecular Sciences
Article Title: Gal3 Plays a Deleterious Role in a Mouse Model of Endotoxemia
doi: 10.3390/ijms23031170
Figure Lengend Snippet: CD4 expression in liver. Representative immunostaining from sections of the different treatments assayed. WT ( A ) and KO ( C ) animals show a normal pattern of CD4 expression; however, the treatment with LPS produces a strong induction of CD4-positive cells in WT animals ( B ). Absence of Gal3 clearly reduces this effect ( D ). Scale bar: 100 μm. ( E ) Quantification of the density of CD4 positive cells in liver. Results are mean ± SD of N = 3 animals, expressed as number of cells per mm 2 . Statistical significance (one-way ANOVA followed by the LSD post hoc test for multiple comparisons): *—compared with WT group; #—compared with KO group; $—compared with WTLPS group; p < 0.001. Abbreviations: WT, wild type mice; WTLPS, wild type mice treated with LPS; KO, Gal3 knockout mice; KOLPS, Gal3 knockout mice treated.
Article Snippet: Primary antibodies used were goat-derived
Techniques: Expressing, Immunostaining, Knock-Out

Journal: International Journal of Molecular Sciences
Article Title: Gal3 Plays a Deleterious Role in a Mouse Model of Endotoxemia
doi: 10.3390/ijms23031170
Figure Lengend Snippet: Determination of TNF-α and IL-6 levels in serum. TNF-α ( A ) and IL-6 ( B ) levels in serum of WT and Gal3KO animals. Blood samples were collected from the heart of mice 1 h after LPS/saline injection. Results are mean ± SD of N = 4–10 animals, expressed as ng/mLof the analyzed protein and relative to the WT group. Statistical significance (one-way ANOVA followed by the LSD post hoc test for multiple comparisons): *—compared with WT group; #—compared with KO group; $—compared with WTLPS group; p < 0.001. Abbreviations: WT, wild type mice; KO, Gal3 knockout mice; WTLPS, wild type mice treated with LPS; KOLPS, Gal3 knockout mice treated with LPS.
Article Snippet: Primary antibodies used were goat-derived
Techniques: Saline, Injection, Knock-Out

Journal: International Journal of Molecular Sciences
Article Title: Gal3 Plays a Deleterious Role in a Mouse Model of Endotoxemia
doi: 10.3390/ijms23031170
Figure Lengend Snippet: Histopathology of the livers of mice from the different treatments assayed. ( A ) Hepatic lobule with Remak cords of apparently normal hepatocytes (arrow). ( B ) Detail of hepatocyte with abundant rough endoplasmic reticulum (RER) and mitochondria (circle). ( C ) Hepatic parenchyma, appreciating abundant unilocular and multilocular steatosis (arrow). ( D ) Detail of hepatocyte with abundant diffuse fat (circle). ( E ) Detail of Remak cords with steatosis in the hepatocytes (circle). ( F ) Hepatocytes with vacuolations of its membranous system (arrow). ( G ) Histological score showing a semiquantitative analysis of steatosis in the liver. The pathology scores were as follows: 0, without significant injuries (0%); 1, minimum (<10%); 2, mild (11–25%); 3, moderate (26–50%); 4, marked (51–75%); 5, severe (>75%). Histopathological evaluation is performed in a blind manner by two highly experienced pathologists. Results are mean ± SD of N = 3 animals.Statistical significance (two tailed Student- t test): * p < 0.001. Abbreviations: WT, wild type mice; WTLPS, wild type mice treated with LPS; KO, Gal3 knockout mice; KOLPS, Gal3 knockout mice treated with LPS; ND, not damaged. ( A , C , E ), optical microscopy. Scale bars: 100 µm. ( B , D , F ), ultrastructural observations. Scale bars: ( B ), 10 µm; ( D , F ), 5 µm.
Article Snippet: Primary antibodies used were goat-derived
Techniques: Histopathology, Two Tailed Test, Knock-Out, Microscopy

Journal: International Journal of Molecular Sciences
Article Title: Gal3 Plays a Deleterious Role in a Mouse Model of Endotoxemia
doi: 10.3390/ijms23031170
Figure Lengend Snippet: Histopathology of the spleens of mice from the different treatments assayed. ( A ) Apparently normal spleen. Normal white pulp (lymphoid follicles) (circle). ( B ) Marginal zone of the apparently normal spleen. ( C ) Hypertrophy and hyperplasia of lymphoid follicles very marked (circle). ( D ) Detail of lymphoid follicle with abundant lymphoblasts (LB) and lymphocytes (L), and some red blood cells (RBC). ( E ) Detail of spleen with hypertrophy and especially hyperplasia of the lymphoid follicles (circle). ( F ) Detail of lymphoid follicle with lymphocytes (L), lymphoblasts (LB) and reticular cells (RC). ( G ) Histological score showing a semiquantitative analysis of hypertrophy and hyperplasia of lymphoid follicles in the spleen. The pathology scores were as follows: 0, without significant injuries (0%); 1, minimum (<10%); 2, mild (11–25%); 3, moderate (26–50%); 4, marked (51–75%); 5, severe (>75%). Histopathological evaluation is performed in a blind manner by two highly experienced pathologists. Results are mean ± SD of N = 3 animals. Statistical significance (two tailed Student- t test), * p < 0.001. Abbreviations: WT, wild type mice; WTLPS, wild type mice treated with LPS; KO, Gal3 knockout mice; KOLPS, Gal3 knockout mice treated with LPS; ND, not damaged. ( A , C , E ), optical microscopy. Scale bars: 100 µm. ( B , D , F ), ultrastructural observations. Scale bars: ( B , D ), 10 µm; ( F ), 5 µm.
Article Snippet: Primary antibodies used were goat-derived
Techniques: Histopathology, Two Tailed Test, Knock-Out, Microscopy

Journal: International Journal of Molecular Sciences
Article Title: Gal3 Plays a Deleterious Role in a Mouse Model of Endotoxemia
doi: 10.3390/ijms23031170
Figure Lengend Snippet: Histopathology of the lungs of mice from the different treatments assayed. ( A ) Lung in which an apparently normal bronchus (BR) and respiratory lobules (RL) stand out. ( B ) Detail of capillary and pulmonary alveolus separated by the respiratory barrier (circle) formed by the endothelial cell (EC) and pneumocyteI (NI). ( C ) Detail of lung that shows a marked atelectasis in both respiratory lobule (RL) and alveoli (ALV). ( D ) Detail of lung with capillary hyperemia (circle) and hypertrophy of pneumocytes II (NII). ( E ) Lung detail showing atelectasis zones (circle) and emphysema (arrow). ( F ) Septal hypertrophy of pneumocytes II (NII). ( G ) Histological score showing a semiquantitative analysis of atelectasis in the lung. The pathology scores were as follows: 0, without significant injuries (0%); 1, minimum (<10%); 2, mild (11–25%); 3, moderate (26–50%); 4, marked (51–75%); 5, severe (>75%). Histopathological evaluation is performed in a blind manner by two highly experienced pathologists. Results are mean ± SD of N = 3 animals. Statistical significance (two tailed Student- t test), * p < 0.001. Abbreviations: WT, wild type mice; WTLPS, wild type mice treated with LPS; KO, Gal3 knockout mice; KOLPS, Gal3 knockout mice treated with LPS; ND, not damaged. ( A , C , E ), optical microscopy. Scale bars: 100 µm. ( B , D , F ), ultrastructural observations. Scale bars: ( B , F ), 2 µm; ( D ), 5 µm.
Article Snippet: Primary antibodies used were goat-derived
Techniques: Histopathology, Two Tailed Test, Knock-Out, Microscopy

Journal: International Journal of Molecular Sciences
Article Title: Gal3 Plays a Deleterious Role in a Mouse Model of Endotoxemia
doi: 10.3390/ijms23031170
Figure Lengend Snippet: Histopathology of the brains of mice from the different treatments assayed. ( A ) Detail of cerebral cortex with abundant neurons. ( B ) Detail of apparently normal neuron and oligodendrocyte (circle). ( C ) Detail of cerebral cortex, showing mobilization of glia cells (circle). ( D ) Detail of a damaged neuron densified and vacuolized. ( E ) Detail of cerebral cortex with a tenuous hyperemia (circle). ( F ) Detail of neuron with lipofucsin precursor granules (Gr). ( G ) Histological score showing brain damage. The pathology scores were as follows: 0, without significant injuries (0%); 1, minimum (<10%); 2, mild (11–25%); 3, moderate (26–50%); 4, marked (5–75%); 5, severe (>75%). Histopathological evaluation is performed in a blind manner by two highly experienced pathologists. Results are mean ± SD of N = 3 animals. Statistical significance (two tailed Student- t test), * p < 0.001. Abbreviations: WT, wild type mice; WTLPS, wild type mice treated with LPS; KOLPS, Gal3 knockout mice treated with LPS; ND, not damaged. ( A , C , E ), optical microscopy. Scale bars: 100 µm. ( B , D , F ), ultrastructural observations. Scale bars: ( B , F ), 5 µm; ( D ), 2 µm. ( H ) Immunofluorescence of Iba1 showing a normal patter in microglial cells staining. ( I ) When animals were treated with LPS microglial cells activate and proliferate. Scale bars ( H , I ): 100 µm.
Article Snippet: Primary antibodies used were goat-derived
Techniques: Histopathology, Two Tailed Test, Knock-Out, Microscopy, Immunofluorescence, Staining

Journal: International Journal of Molecular Sciences
Article Title: Gal3 Plays a Deleterious Role in a Mouse Model of Endotoxemia
doi: 10.3390/ijms23031170
Figure Lengend Snippet: Sense and antisense sequences of the primers used for the analysis of mRNA expression by qPCR.
Article Snippet: Primary antibodies used were goat-derived
Techniques: Expressing
Journal: bioRxiv
Article Title: Microglia at Sites of Atrophy Restrict the Progression of Retinal Degeneration via Galectin-3 and Trem2 Interactions
doi: 10.1101/2023.07.19.549403
Figure Lengend Snippet: ( A ) UMAP plot showing integrated clustering of immune cells samples from four mouse models of retinal degeneration, including LD model (sorted by Cx3cr1 + ), NaIO 3 model (CD45 + ), P23H model (CD45 + ) and aging model (CD45 + ) and naïve mice (CD45 + ). A total of 15,623 macrophages, including 13,489 microglia, were integrated among four models. PMN, polymorphonuclear neutrophils; mo-MFs, monocyte-derived macrophages; pv-MFs: perivascular macrophages; NK, natural killer. ( B ) UMAP plots showing integrated macrophage clusters by two datasets. Dash circles indicate subretinal microglia (srMG). ( C ) Percentage of sample distribution by clusters. The arrow indicates the enrichment of srMG cluster from degenerating retinas. ( D ) Heatmap of top 30 conserved marker genes of subretinal microglia shared by each model across clusters. Genes were ranked by fold changes. Arrows indicate srMG cluster. ( E ) In situ validation of Gal3 expression on the apical RPE (top) or in the neuroretina from the inner plexiform layer (bottom). Iba1 (green), phalloidin (red, only in RPE) and Gal3 (magenta). Scale bar: 100μm. ( F ) Percentage of Gal3 + cells relative to Iba1 + cells between RPE and neuroretina tissues across models.
Article Snippet: Primary antibodies used were as follows: rabbit anti-Iba1 (Wako #019-19741),
Techniques: Derivative Assay, Marker, In Situ, Expressing

Journal: bioRxiv
Article Title: Microglia at Sites of Atrophy Restrict the Progression of Retinal Degeneration via Galectin-3 and Trem2 Interactions
doi: 10.1101/2023.07.19.549403
Figure Lengend Snippet: ( A ) Iba1 (green) and phalloidin (red) staining in RPE flatmounts from LD-subjected mice as indicated. ( B ) Quantifications of subretinal Iba1 + cells as shown in A. ( C ) Iba1 (green) and phalloidin (red) staining in RPE flatmounts from P23H mice as indicated. ( D ) Quantifications of subretinal Iba1 + cells as shown in C. ( E ) Examples of ERG responses at different flash intensities as indicated. ( F ) Representative retinal cross sections of WT, Lgal3 +/- and Lgal3 -/- in P23H mice. ( G and H ) Quantifications of Gal3 depletion efficiency (G) and frequencies of subretinal Iba1 + cells (H) in Gal3 cKO mice (n=9) compared with genotype control mice (n=9) and tamoxifen control (n=8). Scale bars: 100 μm. Data were collected from 2-3 independent experiments. ***: p<0.001; ns: not significant (one-way ANOVA with Tukey’s post hoc test).
Article Snippet: Primary antibodies used were as follows: rabbit anti-Iba1 (Wako #019-19741),
Techniques: Staining

Journal: bioRxiv
Article Title: Microglia at Sites of Atrophy Restrict the Progression of Retinal Degeneration via Galectin-3 and Trem2 Interactions
doi: 10.1101/2023.07.19.549403
Figure Lengend Snippet: ( A ) Images of phalloidin staining in WT and Lgal3 -/- RPE tissues in LD. ( B ) Quantifications of dysmorphic RPE cells (n=6, 7 and 3, respectively). ( C ) TUNEL (green) and DAPI (blue) staining in WT and Lgal3 -/- retinal cross sections in LD. ONL and INL, outer and inner nuclear layers. ( D ) Quantifications of TUNEL + photoreceptors in ONL (n=5, 5 and 3, respectively). ( E ) Rhodopsin (red) and Iba1 (green) staining in WT and Lgal3 -/- retinal cross sections in LD. Images from single planes of confocal scans were shown. ( F ) Quantifications of rhodopsin+ subretinal microglia (n=4 per group). ( G ) Images of phalloidin staining in WT and Lgal3 -/- RPE tissues at 2 years of age. ( H ) Quantifications of RPE cell size. Dots represent individual images with n=5 mice per group. ( I ) ERG data showing scotopic a- and b-waves in 2-year-old WT (n=5) and Lgal3 -/- (n=5) mice. ( J ) Scotopic a- and b-waves of ERG data among Lgal3 +/+ (n=12), Lgal3 +/- (n=6) and Lgal3 -/- (n=10) in P23H mice. ( K ) Quantifications of ONL thickness among Lgal3 +/+ (n=7), Lgal3 +/- (n=7), and Lgal3 -/- (n=8) in P23H mice. ( L ) Representative images of dysmorphic RPE cells in Gal3 cKO in LD. Iba1, green; phalloidin, red; Gal3, magenta. ( M ) Quantifications of dysmorphic RPE cells in Gal3 cKO mice (n=9) compared with genotype control ( Cx3cr1 CreER/+ Lgals3 fl/fl mice, n=9) and tamoxifen control ( Cx3cr1 CreER/+ mice treated with tamoxifen, n=8). Scale bars: 100μm. Data were collected from 2-3 independent experiments. *: p<0.05; **: p<0.01; ***: p<0.001. One-way ANOVA with Tukey’s post hoc test (B, D and M); unpaired Student’s t-test (F and H); two-way ANOVA with Tukey’s post hoc test (I, J and K).
Article Snippet: Primary antibodies used were as follows: rabbit anti-Iba1 (Wako #019-19741),
Techniques: Staining, TUNEL Assay
Journal: bioRxiv
Article Title: Microglia at Sites of Atrophy Restrict the Progression of Retinal Degeneration via Galectin-3 and Trem2 Interactions
doi: 10.1101/2023.07.19.549403
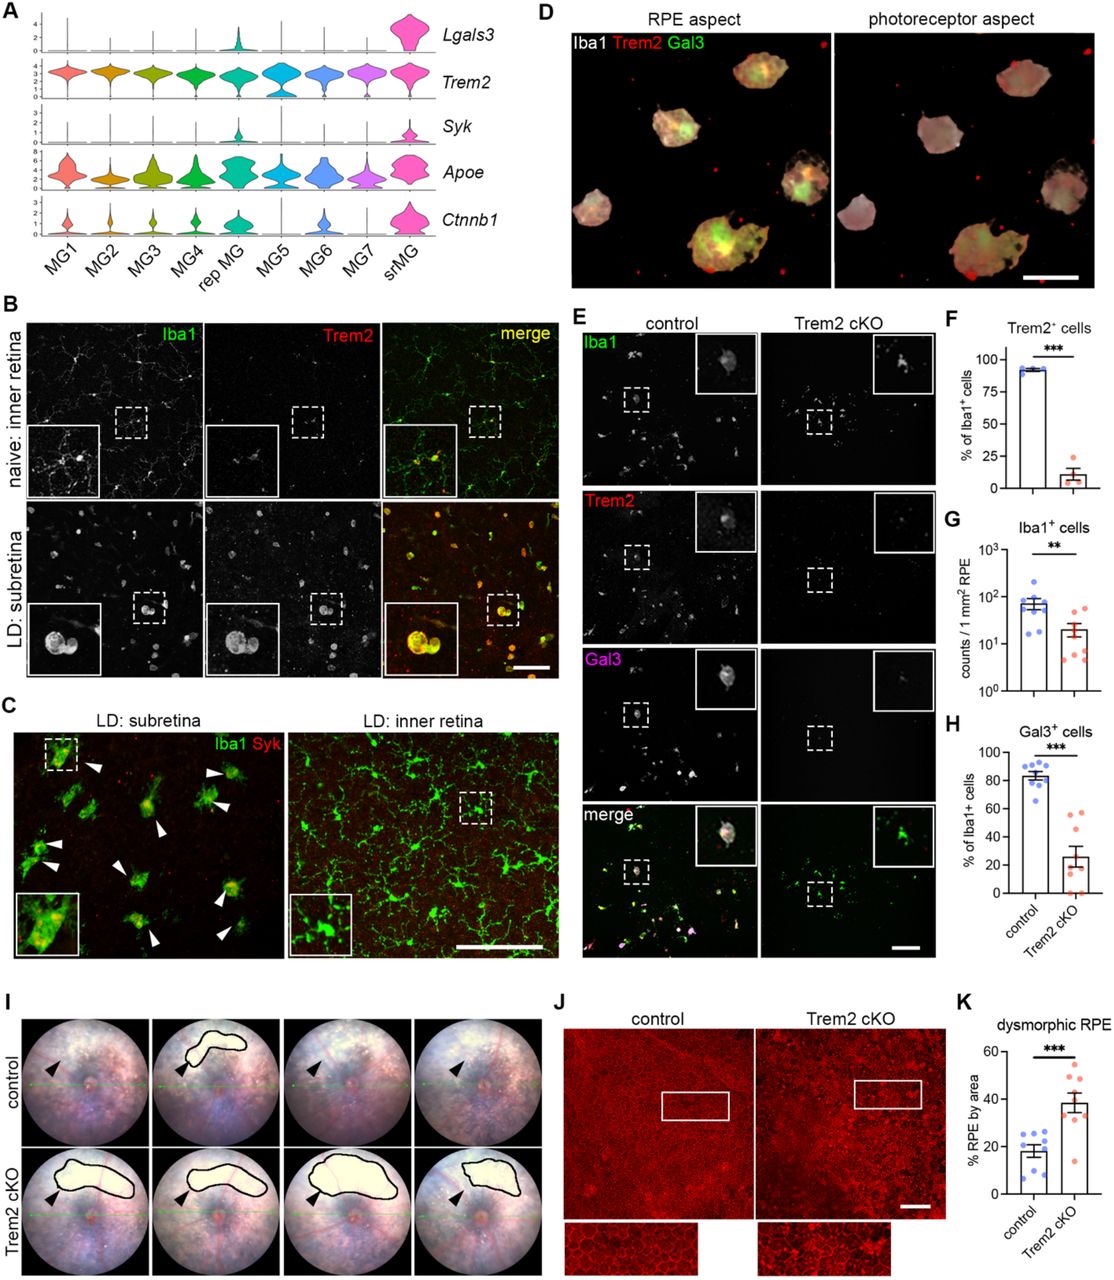
Figure Lengend Snippet: ( A ) Violin plots showing the upregulation of genes ( Lgals3, Syk and Ctnnb1I) related to Trem2 signaling by subretinal microglia from the integrated dataset of all four mouse models. ( B ) Images of Iba1 (green) and Trem2 (red) staining in naïve microglia from inner retina and subretinal microglia in LD. ( C ) Images of Iba1 (green) and Syk (red) staining in subretinal microglia and microglia from inner retina in LD. ( D ) 3D rendering images of Gal3 (green), Trem2 (red) and Iba1 (white) staining in subretinal microglia in LD. Views from both the apical RPE aspect and neuroretina aspect are shown. ( E ) Images of Iba1 (green), Trem2 (red) and Gal3 (magenta) staining in subretinal microglia between control and Trem2 cKO mice in LD. ( F-H ) Quantifications of Trem2 depletion (F, n=4 per group), Iba1 + cells (G, n=9) and Gal3 + cells (H, n=9) between control and Trem2 cKO mice. ( I ) Fundus images showing increased subretinal white lesions in of Trem2 cKO mice in LD as indicated by arrows. Images from four individual mice per group are shown. ( J ) Images of phalloidin staining in RPE tissues from control and Trem2 cKO mice in LD. ( K ) Quantifications of dysmorphic RPE cells between control and Trem2 cKO mice (n=9 per group). Scale bars: 50μm (D); 100μm (B, C E,and J). Data were collected from 2 independent experiments. **: p<0.01; ***: p<0.001. Unpaired Student’s t-test (F-H).
Article Snippet: Primary antibodies used were as follows: rabbit anti-Iba1 (Wako #019-19741),
Techniques: Staining

Journal: bioRxiv
Article Title: Microglia at Sites of Atrophy Restrict the Progression of Retinal Degeneration via Galectin-3 and Trem2 Interactions
doi: 10.1101/2023.07.19.549403
Figure Lengend Snippet: ( A ) Split views of confocal scans showing the colocalization of Trem2 (red) and Gal3 (green) in the subretinal microglia. Lines indicate the RPE-facing and neuroretina (NR)-facing aspects as indicated. ( B ) Fundus images showing increased subretinal white lesions in anti-Trem2 mAb178 treated mice in LD as indicated by arrows. Images of 4 individual mice per group are shown. ( C ) Images of Iba1 (green) and Gal3 (magenta) staining in subretinal microglia between control and mAb178-treated mice in LD. Scale bar: 100 μm. ( D and E ) Quantifications of Iba1 + cells and Gal3 + cells between control and mAb178 (n=8 per group). ( F ) Images of phalloidin staining in RPE flatmounts from control and mAb178 treated mice in LD. Scale bar: 100μm. ( G ) Quantifications of dysmorphic RPE cells between control (n=8) and mAb178 (n=9) treated mice. ( H ) Images of Iba1 (green) and Trem2 (red) in microglia from the inner retina of naïve control and Trem2 cKO mice. Scale bar: 50μm.
Article Snippet: Primary antibodies used were as follows: rabbit anti-Iba1 (Wako #019-19741),
Techniques: Staining

Journal: bioRxiv
Article Title: Microglia at Sites of Atrophy Restrict the Progression of Retinal Degeneration via Galectin-3 and Trem2 Interactions
doi: 10.1101/2023.07.19.549403
Figure Lengend Snippet: ( A ) ELISA of soluble Trem2 (sTrem2) in vitreous fluid and retinal fluid from naïve WT mice, WT and Trem2 cKO mice subjected to LD. ( B ) Fundus images of mice treated with isotype control or 4D9 anti-Trem2 in LD. Four individual mice per group are shown. ( C ) Representative OCT images of mice treated with isotype or 4D9 in LD. ( D ) Quantifications of outer nuclear layer (ONL) thickness by OCT (n=13 per group). ONL thickness was measured at both nasal and temporal sides. ( E and F ) Scotopic a-waves and b-waves of ERG data among mice treated with isotype or 4D9 in naïve or LD setting (n=5 per group). ( G ) Fundus images of Gal3 cKO mice treated with isotype or 4D9 in LD. Four individual mice per group are shown. ( H ) Representative OCT images of Gal3 cKO mice treated with isotype control or 4D9 anti-Trem2 in LD. ( I ) Quantifications of average ONL thickness by OCT between control and Gal3 cKO mice treated with either isotype or 4D9 (n=13 per group). ( J ) Images of phalloidin staining of control and Gal3 cKO RPE treated with isotype or 4D9 in LD. ( K ) Quantifications of dysmorphic RPE cells (n=15, 13, 11 and 13, respectively). Scale bars: 100μm. Data were collected from 2-4 independent experiments. *: p<0.05; **: p<0.01; ***: p<0.001. Unpaired Student’s t-test (F-H). One-way ANOVA with Tukey’s post hoc test (A); two-way ANOVA with Tukey’s post hoc test (D-F, I and K).
Article Snippet: Primary antibodies used were as follows: rabbit anti-Iba1 (Wako #019-19741),
Techniques: Enzyme-linked Immunosorbent Assay, Staining

Journal: bioRxiv
Article Title: Microglia at Sites of Atrophy Restrict the Progression of Retinal Degeneration via Galectin-3 and Trem2 Interactions
doi: 10.1101/2023.07.19.549403
Figure Lengend Snippet: ( A ) Staining of human IgG (red) and Iba1 (green) in retinal cross sections collected from mice with or without 4D9 treatment in LD. The hIgG is used to trace 4D9 antibodies, which outlines retinal vasculatures in 4D9 treated mice. Arrows indicate the presence of 4D9 antibodies in the subretinal microglia, while asters indicate the absence of 4D9 antibodies in microglia from the inner retina. ( B ) Human IgG (red) and Iba1 (green) staining in RPE and neuroretina flatmounts collected from mice treated with 4D9 antibodies in LD. ( C ) Quantifications of hIgG + microglia in the subretinal space and neuroretina. ( D and E ) Quantifications of Iba1 + cells and Gal3 + cells between control and Gal3 cKO mice treated with either isotype or 4D9 (n=13 per group). Scale bars: 100 μm. Data were collected from 2-4 independent experiments. ***: p<0.001; ns: not significant (unpaired Student’s t-test: C; two-way ANOVA with Tukey’s post hoc test: D and E).
Article Snippet: Primary antibodies used were as follows: rabbit anti-Iba1 (Wako #019-19741),
Techniques: Staining

Journal: bioRxiv
Article Title: Microglia at Sites of Atrophy Restrict the Progression of Retinal Degeneration via Galectin-3 and Trem2 Interactions
doi: 10.1101/2023.07.19.549403
Figure Lengend Snippet: ( A ) Multispectral imaging of GAL3 and CD68 co-staining in the subretinal space (top) and inner retina (bottom) from human donors. Unmixed purple spectrum (GAL3) and yellow spectrum (CD68) are shown. The areas of colocalized spectra are highlighted in green. Scale bar: 50μm. ONL and INL, outer and inner nuclear layers. ( B ) Representative image of Gal3 and CD68 co-staining in the macular GA region of a retinal section from an 88-year-old female donor eye with advanced AMD (Sarks V). Black insert box shows the magnification of GA with double positive cells. Scale bar: 200μm. ONL and INL, outer and inner nuclear layers; GCL, ganglion cell layer. ( C ) Correlation between the frequencies of macular Gal3 + CD68 + double positive cells (y axis) and Sarks AMD grading (x axis) by Spearman’s correlation (n = 18 donors, Table S2). Coefficient and p-value are shown. ( D ) Histograms showing increased TREM2 + myeloid cells (CD45 + CD11B + ) in RPE/choroid tissues of AMD donors. Concatenated histograms were shown (n=3 per groups). Control human blood samples were used to set up flow gating. ( E-G ) Quantifications of TREM2 + (E), CD45 + (F), and CD11B + (G) cell frequencies in RPE/choroid tissues between non-AMD and AMD donors. Unpaired Student’s t test is used. P-values are shown. ( H ) Correlation between the frequencies of TREM2 + myeloid cells (y axis) and Sarks AMD grading (x axis) in RPE/choroid tissues by Spearman’s correlation. Coefficient and p-value are shown.
Article Snippet: Primary antibodies used were as follows: rabbit anti-Iba1 (Wako #019-19741),
Techniques: Imaging, Staining

Journal: bioRxiv
Article Title: Microglia at Sites of Atrophy Restrict the Progression of Retinal Degeneration via Galectin-3 and Trem2 Interactions
doi: 10.1101/2023.07.19.549403
Figure Lengend Snippet: ( A ) Images of GAL3 (purple) and CD68 (yellow) co-staining in the macula region of retinal sections from human donors categorized by Sark grades (I-VI). The macular neurosensory retinas of some subject eyes exhibited fixation-related artifactual detachment. In these subjects, separate images of RPE/choroid tissues are shown. Scale bar: 100μm. ONL and INL, outer and inner nuclear layers. GCL, ganglion cell layer. ( B ) Spectral imaging of GAL3 and CD68 co-staining in the geographic atrophy from donor #23 with advanced AMD (Sarks V). Unmixed purple spectrum (GAL3) and yellow spectrum (CD68) are shown. The areas of colocalized spectra are highlighted in green. Scale bar: 50μm. ( C and D ) Images showing the presence of subretinal GAL3 (purple) and CD68 (yellow) double positive cells in the areas with photoreceptor loss and preserved RPE in the transitional area of the macula from an AMD donor (C) and in the age-related peripheral degeneration of a non-AMD donor (D). Scale bars: 100μm. ( E ) Gating strategy of flow cytometry analysis. CD45 + CD11B + cells and CD45 + CD11B - cells from control blood were used to determine the gating of TREM2 + cells. Concatenated plots are shown for non-AMD and AMD. ( F ) Flow contour plots of individual donors showing increased percentage of TREM2 + myeloid cells in AMD.
Article Snippet: Primary antibodies used were as follows: rabbit anti-Iba1 (Wako #019-19741),
Techniques: Staining, Imaging, Flow Cytometry